

Stations de mesure et SI métier : sécuriser la collecte continue sans perdre l’historique
Sécurisez la migration informatique de votre PME en Île-de-France : sauvegardes, continuité des données, restauration et bonnes pratiques IT.
200 villes répondent au seuil minimal de couverture. Le nombre de jours réellement observés est affiché ligne par ligne.
| # | Ville | Département | Moyenne | Tendance | Jours | Mesures |
|---|---|---|---|---|---|---|
| 1 | Montlhéry | 91 | 12,2 µg/m³ | +13,7 % | 29 | 690 |
| 2 | Mamoudzou | 976 | 11,9 µg/m³ | −5,3 % | 27 | 597 |
| 3 | Saint-Denis | 93 | 11,8 µg/m³ | +4,3 % | 29 | 695 |
| 4 | Roubaix | 59 | 11,3 µg/m³ | +41,3 % | 28 | 639 |
| 5 | Grande-Synthe | 59 | 10,8 µg/m³ | +40,9 % | 29 | 693 |
| 6 | Valenciennes | 59 | 10,4 µg/m³ | +41,5 % | 29 | 636 |
| 7 | Bordeaux | 33 | 10,1 µg/m³ | +56,7 % | 29 | 691 |
| 8 | Dunkerque | 59 | 10,0 µg/m³ | +38,4 % | 29 | 1 386 |
| 9 | Béthune | 62 | 10,0 µg/m³ | +68,0 % | 29 | 694 |
| 10 | Tourcoing | 59 | 9,9 µg/m³ | +37,3 % | 29 | 685 |
| 11 | Calais | 62 | 9,4 µg/m³ | +40,2 % | 29 | 690 |
| 12 | Boulogne-sur-Mer | 62 | 9,3 µg/m³ | +52,6 % | 24 | 503 |
| 13 | Nice | 06 | 9,2 µg/m³ | −9,4 % | 29 | 1 348 |
| 14 | Anglet | 64 | 9,1 µg/m³ | +10,0 % | 29 | 681 |
| 15 | Rouen | 76 | 9,1 µg/m³ | +18,0 % | 29 | 692 |
| 16 | Wattignies | 59 | 8,7 µg/m³ | +40,7 % | 29 | 690 |
| 17 | Douai | 59 | 8,6 µg/m³ | +48,7 % | 29 | 696 |
| 18 | Denain | 59 | 8,6 µg/m³ | +42,9 % | 29 | 693 |
| 19 | Avignon | 84 | 8,5 µg/m³ | +18,7 % | 29 | 1 391 |
| 20 | Mâcon | 71 | 8,5 µg/m³ | +31,1 % | 27 | 626 |
| 21 | Paris | 75 | 8,5 µg/m³ | +7,3 % | 29 | 3 461 |
| 22 | Mulhouse | 68 | 8,5 µg/m³ | +36,7 % | 29 | 692 |
| 23 | Bobigny | 93 | 8,5 µg/m³ | +20,1 % | 29 | 696 |
| 24 | Le Havre | 76 | 8,4 µg/m³ | +34,9 % | 29 | 1 377 |
| 25 | Belfort | 90 | 8,4 µg/m³ | +32,2 % | 27 | 629 |
| 26 | Puteaux | 92 | 8,4 µg/m³ | +12,6 % | 29 | 696 |
| 27 | Lyon | 69 | 8,4 µg/m³ | +40,3 % | 29 | 1 388 |
| 28 | La Mulatière | 69 | 8,4 µg/m³ | +31,6 % | 29 | 656 |
| 29 | Gennevilliers | 92 | 8,3 µg/m³ | +17,2 % | 29 | 696 |
| 30 | Gardanne | 13 | 8,2 µg/m³ | stable | 29 | 695 |
| 31 | Annecy | 74 | 8,1 µg/m³ | +45,4 % | 29 | 684 |
| 32 | Nantes | 44 | 8,1 µg/m³ | +45,8 % | 29 | 1 384 |
| 33 | Romans-sur-Isère | 26 | 8,1 µg/m³ | +40,4 % | 29 | 683 |
| 34 | Fréjus | 83 | 8,1 µg/m³ | +20,1 % | 29 | 681 |
| 35 | Coulommiers | 77 | 8,0 µg/m³ | +44,8 % | 29 | 694 |
| 36 | Brest | 29 | 8,0 µg/m³ | +27,1 % | 29 | 694 |
| 37 | Arrest | 80 | 7,9 µg/m³ | +42,0 % | 29 | 696 |
| 38 | Laval | 53 | 7,9 µg/m³ | +39,3 % | 29 | 1 377 |
| 39 | Peillon | 06 | 7,8 µg/m³ | stable | 29 | 696 |
| 40 | Saint-Laurent-Blangy | 62 | 7,8 µg/m³ | +61,5 % | 29 | 667 |
| 41 | Vitry-sur-Seine | 94 | 7,7 µg/m³ | +16,5 % | 29 | 695 |
| 42 | Montpellier | 34 | 7,7 µg/m³ | −8,6 % | 29 | 1 384 |
| 43 | La Talaudière | 42 | 7,6 µg/m³ | +60,3 % | 29 | 695 |
| 44 | Saint-Quentin | 02 | 7,6 µg/m³ | +27,5 % | 29 | 1 380 |
| 45 | Strasbourg | 67 | 7,6 µg/m³ | +11,8 % | 29 | 2 086 |
| 46 | Le Petit-Quevilly | 76 | 7,6 µg/m³ | +19,5 % | 29 | 696 |
| 47 | Beauvais | 60 | 7,6 µg/m³ | +25,4 % | 29 | 693 |
| 48 | Toulon | 83 | 7,5 µg/m³ | −7,8 % | 29 | 1 389 |
| 49 | Thionville | 57 | 7,5 µg/m³ | +10,8 % | 29 | 693 |
| 50 | Bouguenais | 44 | 7,5 µg/m³ | +63,4 % | 29 | 676 |
| 51 | Amiens | 80 | 7,5 µg/m³ | +43,2 % | 29 | 1 165 |
| 52 | Villefranche-sur-Saône | 69 | 7,5 µg/m³ | +48,4 % | 29 | 687 |
| 53 | Saint-Malo | 35 | 7,5 µg/m³ | +99,5 % | 29 | 691 |
| 54 | Nancy | 54 | 7,4 µg/m³ | +4,3 % | 29 | 1 231 |
| 55 | Dreux | 28 | 7,4 µg/m³ | +35,5 % | 29 | 693 |
| 56 | Dieppe | 76 | 7,4 µg/m³ | +22,3 % | 29 | 1 383 |
| 57 | Montbéliard | 25 | 7,4 µg/m³ | +52,7 % | 27 | 632 |
| 58 | Rennes | 35 | 7,3 µg/m³ | +33,0 % | 29 | 1 389 |
| 59 | Dole | 39 | 7,3 µg/m³ | +44,0 % | 27 | 634 |
| 60 | Gaillard | 74 | 7,2 µg/m³ | +23,7 % | 29 | 691 |
| 61 | Aix-en-Provence | 13 | 7,2 µg/m³ | +3,6 % | 29 | 1 390 |
| 62 | Saint-Étienne | 42 | 7,2 µg/m³ | +37,0 % | 28 | 660 |
| 63 | Lorient | 56 | 7,2 µg/m³ | +45,3 % | 29 | 1 388 |
| 64 | Valence | 26 | 7,1 µg/m³ | +34,0 % | 29 | 695 |
| 65 | Salaise-sur-Sanne | 38 | 7,1 µg/m³ | +56,0 % | 28 | 660 |
| 66 | Pusignan | 69 | 7,1 µg/m³ | +34,6 % | 29 | 689 |
| 67 | Arles | 13 | 7,1 µg/m³ | −11,5 % | 28 | 644 |
| 68 | Creil | 60 | 7,1 µg/m³ | +24,7 % | 29 | 696 |
| 69 | Toulouse | 31 | 7,1 µg/m³ | stable | 29 | 3 452 |
| 70 | Passy | 74 | 7,1 µg/m³ | +43,7 % | 29 | 693 |
| 71 | Bassens | 33 | 7,0 µg/m³ | +40,5 % | 29 | 693 |
| 72 | Poitiers | 86 | 7,0 µg/m³ | +30,2 % | 29 | 695 |
| 73 | Gaudechart | 60 | 7,0 µg/m³ | +31,9 % | 29 | 696 |
| 74 | Talence | 33 | 7,0 µg/m³ | +37,8 % | 29 | 694 |
| 75 | Saint-Nazaire | 44 | 7,0 µg/m³ | +63,4 % | 29 | 695 |
| 76 | Moulins | 03 | 7,0 µg/m³ | +62,2 % | 29 | 695 |
| 77 | Vannes | 56 | 7,0 µg/m³ | +50,6 % | 29 | 696 |
| 78 | Saint-Martin-d'Hères | 38 | 7,0 µg/m³ | +9,3 % | 29 | 693 |
| 79 | Annemasse | 74 | 6,9 µg/m³ | +9,4 % | 29 | 688 |
| 80 | Dijon | 21 | 6,9 µg/m³ | +19,9 % | 27 | 1 194 |
| 81 | Gonesse | 95 | 6,9 µg/m³ | +7,3 % | 29 | 691 |
| 82 | La Roche-sur-Yon | 85 | 6,9 µg/m³ | +47,6 % | 29 | 693 |
| 83 | Marseille | 13 | 6,9 µg/m³ | −12,9 % | 29 | 1 314 |
| 84 | Marmande | 47 | 6,9 µg/m³ | +30,0 % | 29 | 688 |
| 85 | Notre-Dame-de-Bliquetuit | 76 | 6,8 µg/m³ | +60,2 % | 24 | 429 |
| 86 | Évreux | 27 | 6,8 µg/m³ | +29,0 % | 29 | 661 |
| 87 | Lunéville | 54 | 6,8 µg/m³ | −44,2 % | 29 | 695 |
| 88 | Bourg-en-Bresse | 01 | 6,7 µg/m³ | +29,6 % | 29 | 694 |
| 89 | Marignane | 13 | 6,7 µg/m³ | −10,2 % | 29 | 674 |
| 90 | Montauban | 82 | 6,7 µg/m³ | +30,5 % | 29 | 691 |
| 91 | Chalon-sur-Saône | 71 | 6,7 µg/m³ | +17,9 % | 27 | 610 |
| 92 | Nîmes | 30 | 6,7 µg/m³ | +5,5 % | 29 | 692 |
| 93 | Cartignies | 59 | 6,6 µg/m³ | +27,3 % | 29 | 692 |
| 94 | Caen | 14 | 6,6 µg/m³ | +21,8 % | 29 | 693 |
| 95 | Frossay | 44 | 6,6 µg/m³ | +45,1 % | 29 | 695 |
| 96 | La Valette-du-Var | 83 | 6,6 µg/m³ | −13,6 % | 29 | 694 |
| 97 | Gonfreville-l'Orcher | 76 | 6,6 µg/m³ | +21,8 % | 29 | 696 |
| 98 | Eybens | 38 | 6,6 µg/m³ | stable | 29 | 687 |
| 99 | Fos-sur-Mer | 13 | 6,6 µg/m³ | −3,1 % | 29 | 693 |
| 100 | Forbach | 57 | 6,6 µg/m³ | +6,3 % | 29 | 695 |
| 101 | Rognac | 13 | 6,6 µg/m³ | +9,7 % | 29 | 686 |
| 102 | Vichy | 03 | 6,5 µg/m³ | +45,2 % | 29 | 695 |
| 103 | Cherbourg-en-Cotentin | 50 | 6,5 µg/m³ | +20,9 % | 29 | 1 390 |
| 104 | Donges | 44 | 6,5 µg/m³ | +41,3 % | 29 | 1 389 |
| 105 | Saint-Jean-de-la-Ruelle | 45 | 6,5 µg/m³ | +25,1 % | 29 | 696 |
| 106 | Bourgoin-Jallieu | 38 | 6,5 µg/m³ | +29,1 % | 29 | 691 |
| 107 | Albi | 81 | 6,4 µg/m³ | +17,5 % | 29 | 688 |
| 108 | Montargis | 45 | 6,4 µg/m³ | +3,9 % | 29 | 1 382 |
| 109 | Castres | 81 | 6,4 µg/m³ | +23,4 % | 29 | 692 |
| 110 | Chartres | 28 | 6,4 µg/m³ | +25,6 % | 29 | 1 388 |
| 111 | Plan-d'Aups-Sainte-Baume | 83 | 6,4 µg/m³ | +20,1 % | 28 | 654 |
| 112 | Albertville | 73 | 6,4 µg/m³ | +4,9 % | 29 | 693 |
| 113 | Sotteville-lès-Rouen | 76 | 6,3 µg/m³ | +11,9 % | 29 | 676 |
| 114 | Orléans | 45 | 6,3 µg/m³ | +30,4 % | 23 | 530 |
| 115 | Val-de-Reuil | 27 | 6,3 µg/m³ | +14,8 % | 29 | 693 |
| 116 | Quimper | 29 | 6,3 µg/m³ | +47,4 % | 29 | 696 |
| 117 | Angoulême | 16 | 6,3 µg/m³ | +31,9 % | 29 | 694 |
| 118 | Cannes | 06 | 6,3 µg/m³ | −17,4 % | 29 | 692 |
| 119 | Auxerre | 89 | 6,2 µg/m³ | +21,1 % | 27 | 634 |
| 120 | Saint-Étienne-de-Montluc | 44 | 6,2 µg/m³ | +49,6 % | 29 | 695 |
| 121 | Haguenau | 67 | 6,2 µg/m³ | +20,0 % | 29 | 691 |
| 122 | Saint-Denis-d'Anjou | 53 | 6,2 µg/m³ | +33,1 % | 29 | 695 |
| 123 | Joué-lès-Tours | 37 | 6,2 µg/m³ | +28,8 % | 29 | 695 |
| 124 | Nevers | 58 | 6,2 µg/m³ | +55,6 % | 27 | 632 |
| 125 | Montoir-de-Bretagne | 44 | 6,2 µg/m³ | +48,9 % | 29 | 694 |
| 126 | Châteauroux | 36 | 6,2 µg/m³ | +43,3 % | 29 | 695 |
| 127 | Reims | 51 | 6,1 µg/m³ | −3,8 % | 29 | 1 321 |
| 128 | Grenoble | 38 | 6,1 µg/m³ | stable | 29 | 691 |
| 129 | Épinal | 88 | 6,1 µg/m³ | +36,4 % | 29 | 694 |
| 130 | Cerisé | 61 | 6,1 µg/m³ | +27,6 % | 29 | 696 |
| 131 | Rambouillet | 78 | 6,1 µg/m³ | +12,1 % | 29 | 696 |
| 132 | Périgueux | 24 | 6,1 µg/m³ | +24,7 % | 29 | 696 |
| 133 | Le Palais-sur-Vienne | 87 | 6,0 µg/m³ | +109,2 % | 29 | 678 |
| 134 | Salon-de-Provence | 13 | 6,0 µg/m³ | −9,1 % | 29 | 696 |
| 135 | Gap | 05 | 6,0 µg/m³ | +14,1 % | 29 | 1 384 |
| 136 | Ajaccio | 2A | 6,0 µg/m³ | +8,6 % | 29 | 1 230 |
| 137 | Angers | 49 | 6,0 µg/m³ | +20,9 % | 29 | 1 390 |
| 138 | Le Mans | 72 | 6,0 µg/m³ | +26,3 % | 29 | 695 |
| 139 | Terval | 85 | 6,0 µg/m³ | +42,2 % | 29 | 689 |
| 140 | Saint-Chamond | 42 | 6,0 µg/m³ | +20,5 % | 29 | 690 |
| 141 | Cayenne | 973 | 5,9 µg/m³ | −24,8 % | 29 | 821 |
| 142 | Neuilly-Saint-Front | 02 | 5,9 µg/m³ | +20,1 % | 29 | 693 |
| 143 | Lunel-Viel | 34 | 5,9 µg/m³ | stable | 29 | 693 |
| 144 | Crolles | 38 | 5,9 µg/m³ | +30,9 % | 29 | 690 |
| 145 | Jonville-en-Woëvre | 55 | 5,8 µg/m³ | +18,8 % | 29 | 673 |
| 146 | Niort | 79 | 5,8 µg/m³ | +48,1 % | 29 | 696 |
| 147 | Saint-Martin-du-Tertre | 95 | 5,8 µg/m³ | +21,6 % | 29 | 696 |
| 148 | Champforgeuil | 71 | 5,8 µg/m³ | +34,9 % | 27 | 619 |
| 149 | Baume-les-Dames | 25 | 5,8 µg/m³ | +31,3 % | 27 | 607 |
| 150 | Saint-Dizier | 52 | 5,8 µg/m³ | +9,4 % | 29 | 691 |
| 151 | Chambéry | 73 | 5,7 µg/m³ | +15,3 % | 29 | 681 |
| 152 | Bourges | 18 | 5,7 µg/m³ | +31,7 % | 29 | 695 |
| 153 | Clermont-Ferrand | 63 | 5,7 µg/m³ | +40,8 % | 29 | 1 312 |
| 154 | Mont-de-Marsan | 40 | 5,7 µg/m³ | −9,9 % | 29 | 696 |
| 155 | Montluçon | 03 | 5,6 µg/m³ | +35,9 % | 29 | 696 |
| 156 | Biarritz | 64 | 5,6 µg/m³ | +65,1 % | 27 | 604 |
| 157 | Vaulx-en-Velin | 69 | 5,6 µg/m³ | −4,8 % | 29 | 666 |
| 158 | La Rochelle | 17 | 5,6 µg/m³ | +83,2 % | 29 | 1 328 |
| 159 | Limoges | 87 | 5,6 µg/m³ | +36,1 % | 29 | 681 |
| 160 | Villiers-en-Bois | 79 | 5,6 µg/m³ | +39,9 % | 29 | 694 |
| 161 | Perpignan | 66 | 5,6 µg/m³ | −3,8 % | 29 | 1 365 |
| 162 | Port-de-Bouc | 13 | 5,5 µg/m³ | stable | 28 | 628 |
| 163 | Montceau-les-Mines | 71 | 5,5 µg/m³ | +23,0 % | 23 | 502 |
| 164 | Tours | 37 | 5,5 µg/m³ | +32,0 % | 29 | 1 378 |
| 165 | Merléac | 22 | 5,5 µg/m³ | +25,5 % | 22 | 499 |
| 166 | Belleville-sur-Meuse | 55 | 5,4 µg/m³ | +14,1 % | 29 | 695 |
| 167 | Épernay | 51 | 5,4 µg/m³ | +21,1 % | 29 | 688 |
| 168 | Kourou | 973 | 5,3 µg/m³ | −14,3 % | 29 | 688 |
| 169 | Le Lamentin | 972 | 5,3 µg/m³ | −44,8 % | 29 | 649 |
| 170 | Bois-Herpin | 91 | 5,3 µg/m³ | +12,5 % | 29 | 696 |
| 171 | Saint-Leu | 974 | 5,3 µg/m³ | +10,2 % | 30 | 698 |
| 172 | Sainte-Luce | 972 | 5,2 µg/m³ | −54,6 % | 29 | 692 |
| 173 | Rodez | 12 | 5,2 µg/m³ | +17,4 % | 29 | 693 |
| 174 | Metz | 57 | 5,1 µg/m³ | −17,1 % | 28 | 598 |
| 175 | Paray-le-Frésil | 03 | 5,0 µg/m³ | +43,1 % | 29 | 696 |
| 176 | La Coulonche | 61 | 5,0 µg/m³ | +15,8 % | 29 | 696 |
| 177 | Pointe-à-Pitre | 971 | 5,0 µg/m³ | −48,6 % | 28 | 625 |
| 178 | Blois | 41 | 4,9 µg/m³ | +45,1 % | 29 | 1 367 |
| 179 | Tarbes | 65 | 4,9 µg/m³ | −18,5 % | 29 | 693 |
| 180 | Billère | 64 | 4,8 µg/m³ | −18,0 % | 29 | 691 |
| 181 | Schœlcher | 972 | 4,8 µg/m³ | −53,4 % | 29 | 687 |
| 182 | Besançon | 25 | 4,8 µg/m³ | +49,1 % | 27 | 620 |
| 183 | Fontainebleau | 77 | 4,7 µg/m³ | +19,3 % | 29 | 696 |
| 184 | Sainte-Savine | 10 | 4,7 µg/m³ | +55,4 % | 29 | 663 |
| 185 | Vesoul | 70 | 4,7 µg/m³ | +52,5 % | 23 | 447 |
| 186 | Saint-Pierre | 974 | 4,7 µg/m³ | +12,3 % | 30 | 1 377 |
| 187 | Le Robert | 972 | 4,6 µg/m³ | −53,4 % | 28 | 631 |
| 188 | Saint-Germain-sur-Rhône | 74 | 4,6 µg/m³ | +18,3 % | 29 | 695 |
| 189 | Saint-Denis | 974 | 4,5 µg/m³ | +39,6 % | 29 | 673 |
| 190 | Peyrusse-Vieille | 32 | 4,4 µg/m³ | −15,3 % | 29 | 691 |
| 191 | Fort-de-France | 972 | 4,4 µg/m³ | −53,3 % | 29 | 652 |
| 192 | Bastia | 2B | 4,3 µg/m³ | −16,5 % | 29 | 1 328 |
| 193 | Montandon | 25 | 4,3 µg/m³ | +14,7 % | 23 | 511 |
| 194 | Les Mazures | 08 | 4,2 µg/m³ | stable | 29 | 694 |
| 195 | Aurillac | 15 | 4,1 µg/m³ | +22,3 % | 29 | 696 |
| 196 | Grandfontaine | 67 | 3,9 µg/m³ | stable | 29 | 694 |
| 197 | Saint-Brisson | 58 | 3,8 µg/m³ | +36,1 % | 27 | 616 |
| 198 | Basse-Terre | 971 | 3,8 µg/m³ | −57,8 % | 29 | 691 |
| 199 | Saint-Paul | 974 | 3,7 µg/m³ | stable | 30 | 698 |
| 200 | Colmar | 68 | 3,6 µg/m³ | +29,2 % | 20 | 458 |
Le rang compare uniquement les villes présentes dans cette fenêtre et disposant d’un minimum de données. Il ne constitue pas un palmarès sanitaire absolu.
Diffusez cette page, citez-la proprement ou créez un widget à intégrer sur un autre site.
Guides et décryptages sur l’air, l’environnement, l’habitat et les solutions pour mieux comprendre notre cadre de vie.
Sécurisez la migration informatique de votre PME en Île-de-France : sauvegardes, continuité des données, restauration et bonnes pratiques IT.
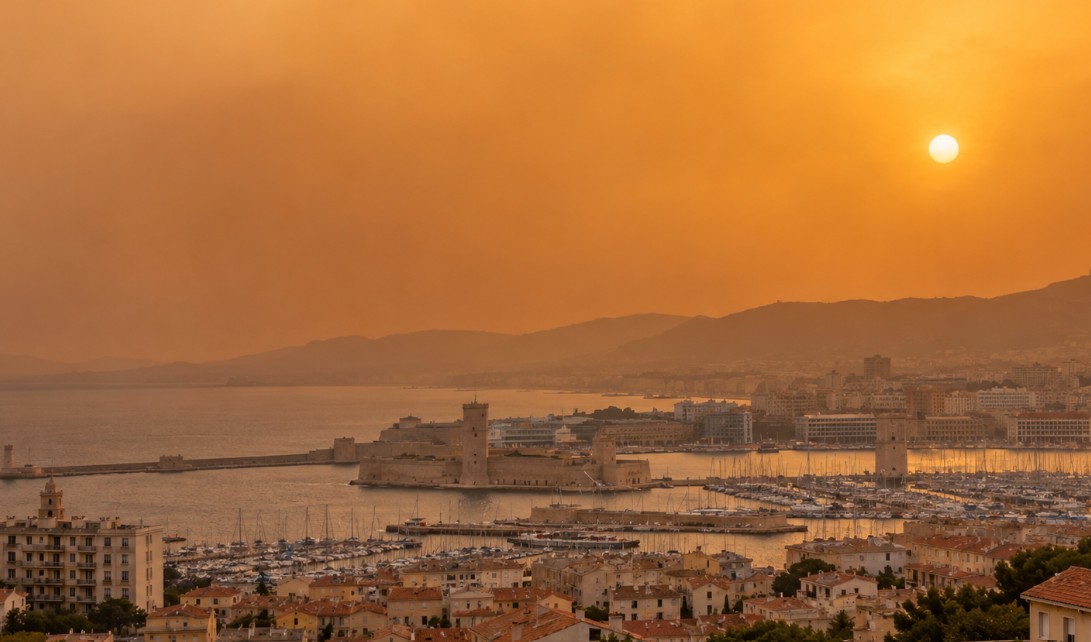
Pourquoi le sable du Sahara arrive-t-il en France ? Découvrez comment ces poussières colorent le ciel, augmentent les PM10 et affectent la qualit

Vous habitez près d'une usine ou d'une zone industrielle ? Découvrez comment surveiller les polluants, comprendre les mesures et signaler des nui

Pourquoi l'air est-il parfois plus pollué dans les vallées alpines ? Découvrez le rôle du relief, des inversions thermiques et du chauffage en hi

Pollution dans les écoles et crèches : découvrez les obligations réglementaires en 2026, les seuils de CO₂ et les solutions pour améliorer l’air

Voiture, vélo, marche ou transports en commun : découvrez comment limiter votre exposition à la pollution automobile lors de vos trajets quotidie